Teen_Mental_Health_Analysis
Created by Hieu Nguyen
Teen Mental Health EDA
https://hnguyen76.github.io/Teen_Mental_Health_Analysis/reports/DASHBOARD.html
Exploratory data analysis project focused on teen social media behavior, sleep habits, academic performance, stress, anxiety, addiction level, and depression label indicators.
This repository contains a complete beginner-friendly data workflow:
- Load and inspect raw CSV data.
- Clean categorical text values and validate numeric ranges.
- Export a cleaned dataset.
- Build visualizations with pandas, Matplotlib, and Seaborn.
- Summarize key findings in professional project reports.
Project Status
Status: Active learning project
Primary dataset: Teen_Mental_Health_Dataset.csv
Cleaned dataset: Teen_Mental_Health_Cleaned.csv
Cleaning script: cleaning.py
Main visualization notebook: teen_visiualize.ipynb
Dashboard app: dashboard.py
GitHub-viewable dashboard: reports/DASHBOARD.md
Repository Structure
.
|-- Teen_Mental_Health_Dataset.csv
|-- Teen_Mental_Health_Cleaned.csv
|-- reports/
|   |-- DATA_CLEANING_REPORT.md
|   |-- DATA_DICTIONARY.md
|   |-- DASHBOARD.md
|   |-- EDA_REPORT.md
|   |-- figures/
|   |-- SOW.md
|   `-- VISUALIZATION_REPORT.md
|-- cleaning.py
|-- dashboard.py
|-- generate_static_dashboard.py
|-- teen_visiualize.ipynb
|-- requirements.txt
`-- README.md
Business Question
How do teen lifestyle and digital behavior variables relate to sleep, academic performance, stress, anxiety, addiction level, and depression label outcomes?
This project is descriptive EDA. It identifies patterns and relationships in the dataset, but it does not prove causation and should not be used as medical advice.
Dataset Overview
The cleaned teen dataset contains:
- Rows: 1,200
- Columns: 13
- Missing values after cleaning: 0
- Duplicate rows after cleaning: 0
- Age range: 13 to 19
Key columns include:
agegenderdaily_social_media_hoursplatform_usagesleep_hoursscreen_time_before_sleepacademic_performancephysical_activitysocial_interaction_levelstress_levelanxiety_leveladdiction_leveldepression_label
See reports/DATA_DICTIONARY.md for the full data dictionary.
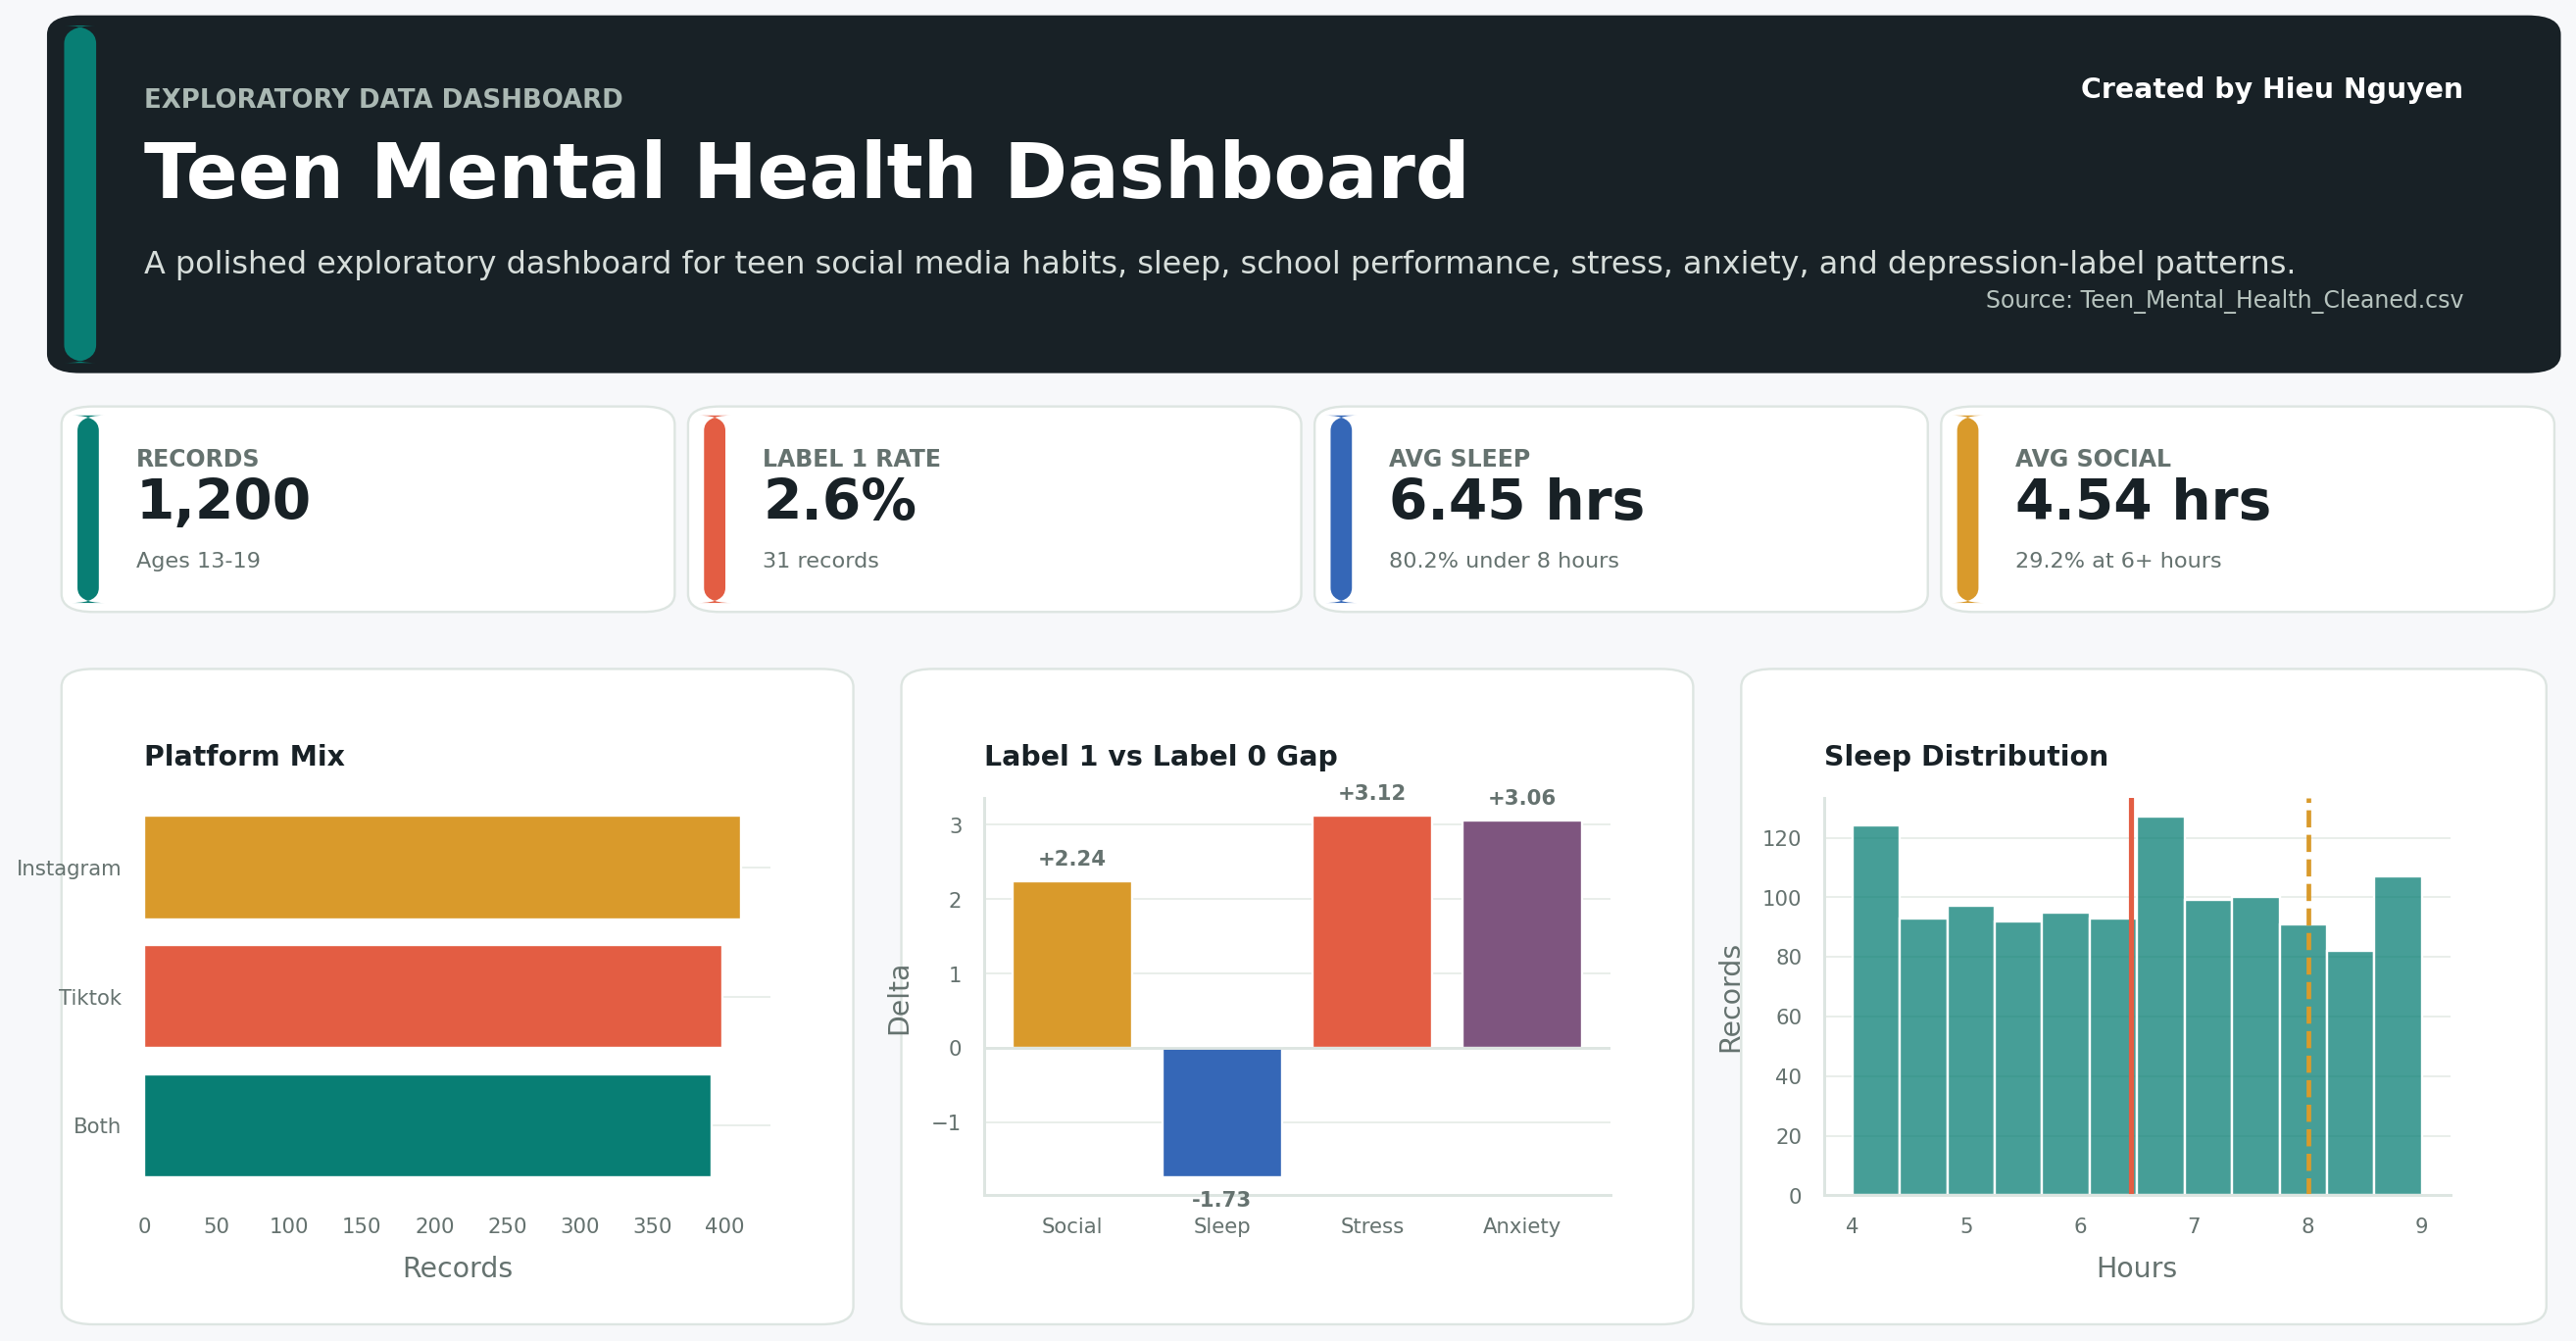
Key Findings
- The dataset contains 1,200 teen records with no missing values or duplicate rows after cleaning.
- Average age is approximately 15.93 years.
- Average daily social media use is approximately 4.54 hours.
- Average sleep is approximately 6.45 hours.
- About 80.17% of records show sleep below 8 hours.
- Depression label distribution is highly imbalanced: 31 records are labeled
1, representing 2.58% of the dataset. - Teens with depression label
1show lower average sleep hours than label0. - Teens with depression label
1show higher average daily social media hours than label0. - Academic performance above 3.5 appears in 285 records, or 23.75% of the dataset.
Detailed interpretation is available in reports/EDA_REPORT.md.
GitHub Dashboard Preview
Open the full static dashboard here:
Reports
- Statement of Work
- Data Dictionary
- GitHub Dashboard
- Data Cleaning Report
- EDA Report
- Visualization Report
Environment Setup
Create and activate a virtual environment:
python -m venv .venv2
.\.venv2\Scripts\activate
Install dependencies:
python -m pip install -r requirements.txt
Start Jupyter:
jupyter notebook
Open the visualization notebook:
teen_visiualize.ipynb
Dashboard
View the static dashboard directly on GitHub:
Run the Streamlit dashboard:
streamlit run dashboard.py
Regenerate the GitHub dashboard charts:
python generate_static_dashboard.py
The dashboard includes:
- Sidebar filters for age, gender, platform, social interaction level, and depression label.
- KPI cards for record count, label 1 rate, average sleep, average social media use, and sleep below 8 hours.
- Overview, lifestyle signal, label comparison, and data table tabs.
- A filtered CSV download button.
Common Commands
Load the cleaned dataset:
import pandas as pd

df = pd.read_csv("Teen_Mental_Health_Cleaned.csv")
df.head()
Check missing values:
df.isnull().sum()
Check duplicate rows:
df.duplicated().sum()
Export a cleaned CSV:
df.to_csv("Teen_Mental_Health_Cleaned.csv", index=False)
Important Notes
- This project is for data analysis and learning purposes.
- The
depression_labelcolumn is treated as a dataset label, not a clinical diagnosis. - Correlation and group averages should be interpreted carefully.
- Findings should not be used to make medical, educational, or policy decisions without additional validation.